Behind any season – whether a squad claimed the ultimate prize, went 13-1 record setting numerous offensive and defensive records, or languished in mediocrity – there are always a host of stats that help tell the tale of that particular group's success.
Even great teams produce meh stats in certain categories while awful teams can excel at any particular statistical facet which of course oftentimes means it's wise to take stats with a grain of salt.
This past season's Buckeyes – Urban Meyer's last in Columbus – are no exception. Obviously the passing offense was on another planet thanks to Dwayne Haskins and an explosive group of receivers. The prolific pass offense's story has been well-documented so I won't focus on its exploits here.
With that, here are five lesser-known statistics worthy of inclusion into the post-mortem of the 2018 Ohio State football season.
OPPONENTS START WITH THE SECOND-WORST FIELD POSITION IN THE COUNTRY
Ohio State's offense was so sexy and its defense often so uh, not sexy, that the other aspect of the squad, special teams, got a little lost in the sauce.
| YEAR | AVG YARDS FROM EZ | NATL RANK |
|---|---|---|
| 2018 | 73.90 | 2 |
| 2017 | 71.04 | 22 |
| 2016 | 71.23 | 33 |
| 2015 | 68.84 | 5 |
| 2014 | 70.92 | 11 |
| 2013 | 74.64 | 2 |
| 2012 | 70.96 | 48 |
In particular, Meyer's kick coverage units were as strong as ever.
His kickoff coverage group allowed just 14.91 yards per return, good for second in the country, trailing only New Mexico by .02 yards per attempt.
Meyer's kickoff coverage team actually had more chances than you might have thought when comparing to the rest of the country as Ohio State covered an average of 2.4 kickoff returns per game, good for 70th nationally.
Punt coverage was also tight as the Buckeyes allowed a mere 3.31 yards per return which slotted eighth in the land. As for volume, Ohio State covered 0.9 punt returns per game, good for 23rd nationally.
Mesh the kickoff and punt coverage units together, among other variables, and Ohio State ranked second in the country in opponent's average starting field position with foes beginning possessions, on average, 73.90 yards from the end zone.
This past season marked the fourth time in seven years Meyer's squad ranked in the top 11 nationally in forcing opponents to start possessions deep in their own territory.
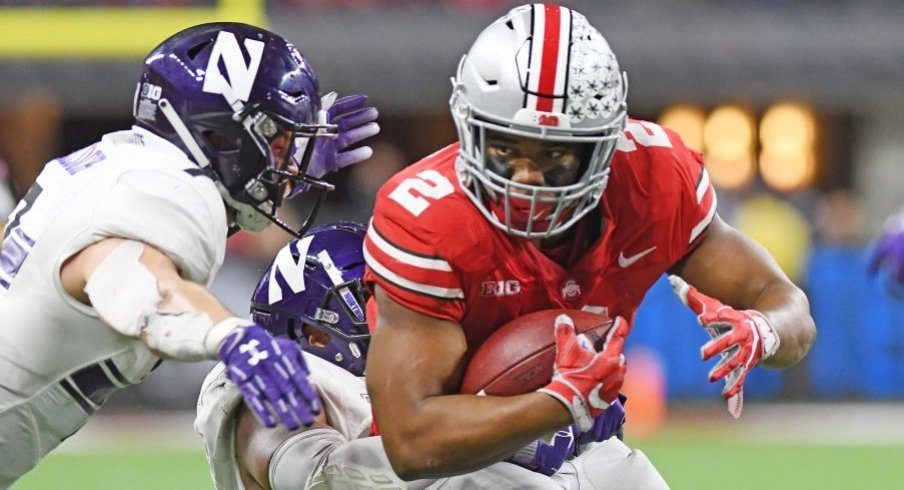
J.K. DOBBINS RUSHES FOR 4.6 YARDS PER CARRY
The fact J.K. Dobbins rushed for just 4.6 yards per carry in 2018 blows my mind.
Dobbins still managed to post 1,053 rushing yards on the season but it took 230 attempts to get there.
Dobbins' 4.6 yards per attempt stands as the worst average by a Buckeye running back to lead the team in rushing yards since Lydell Ross averaged 4.1 yards per carry back in 2004. It should be noted Braxton Miller averaged 4.5 yards per carry as the team's leading rusher in 2011 but he obviously did that from the quarterback position and from behind an offensive line that gave up FORTY-SIX sacks.
For comparison sake, Miller lost 236 yards rushing that season compared to 26 for Dobbins this past fall.
Another eye-catcher for comparison, Dobbins averaged 7.2 yards per carry in 2017 which was the second-best single-season mark in school history for the team's leading rusher, trailing only Carlos Hyde's mark of 7.3 in 2013.
Like I said, 4.6 for Dobbins in 2018 is a head-scratcher.
DEFENSE ALLOWS A PROGRAM-WORST 4.52 YARDS PER CARRY
You don't need numbers to tell you Ohio State's 2018 defense was largely a dumpster fire.
| YEAR | YPC | NATL RANK |
|---|---|---|
| 2018 | 4.52 | 79 |
| 2017 | 2.94 | 4 |
| 2016 | 3.35 | 12 |
| 2015 | 3.38 | 14 |
| 2014 | 3.95 | 43 |
| 2013 | 3.29 | 12 |
| 2012 | 3.55 | 21 |
Eyes and emotions worked just fine for that.
But one of the more shocking stats from a disappointing defensive campaign was the rush defense giving up a school record 4.52 yards per carry.
The 4.52 per try ranked 79th in the country, shattering the 1989 squad's penchant for futility of 4.4 yards per rushing attempt and was more than a half-yard worse than any previous Meyer team in Columbus had allowed.
Big plays obviously impacted the average as the Buckeyes ranked 124th nationally allowing eight rushes of at least 50 yards.
The rush defense also gave up a school record 26 touchdowns and ensured a Buckeye offense would generate less rushing touchdowns than the defense allowed for the first time since 1988.
BUCKEYES AVERAGE 8.3 PENALTIES PER GAME - WORST MARK OF MEYER ERA
Meyer's teams have been no stranger to referees.
His Ohio State squads have never ranked better than 45th nationally in both fewest penalties per game and fewest penalty yards per game.
| YEAR | PENALTIES/G | NATL RANK | PENALTY YDS/G | NATL RANK |
|---|---|---|---|---|
| 2018 | 8.3 | 125 | 75.4 | 127 |
| 2017 | 6.9 | 100 | 67.4 | 114 |
| 2016 | 6.3 | 69 | 50.6 | 50 |
| 2015 | 5.8 | 51 | 50.1 | 46 |
| 2014 | 5.6 | 52 | 47.4 | 45 |
| 2013 | 5.2 | 45 | 45.6 | 55 |
| 2012 | 7.0 | 99 | 64.5 | 107 |
This past season proved to be the worst of the Meyer era as Ohio State ranked 125th in penalties per game with 8.3 and 127th in penalty yards per game with an average of 75.4.
There are only 130 FBS teams y'all.
The 2018 Buckeyes churned out 35 more flags and 274 more penalty yards that their opponents, recording at least nine penalties in nine of 13 games, including the last four in a row.
Penalties don't always matter, of course, as evidenced by the 12 penalties for 150 yards coming in the dismantling of Michigan but the reality is Meyer's teams struggled to keep the yellow off the field.
HISTORICALLY BAD DEFENSE IS STILL PRETTY DAMN GOOD ON THIRD DOWN
I could've easily pulled five sad stats focused only the defense but that's no fun.
| YEAR | CONV % | NATL RANK |
|---|---|---|
| 2018 | 32.68 | 15 |
| 2017 | 32.02 | 17 |
| 2016 | 32.16 | 11 |
| 2015 | 34.91 | 29 |
| 2014 | 33.95 | 13 |
| 2013 | 35.61 | 30 |
| 2012 | 32.98 | 19 |
That said, I'll close with one other defensive stat but this one is actually a win.
Despite all the issues with stopping the run and giving up big plays in general, Ohio State's defense was solid in many areas.
One in particular: The Buckeyes ranked 15th in the country posting a opponent third down conversion rate of just 32.68%.
Season highlights here include holding Penn State to just 3-of-17 and Indiana to 3-of-14 on third downs in back-to-back weeks.
None of Ohio State's opponents converted at least half of their third down tries. TCU set the pace with a 46.7% mark (7-for-15) in its 40-28 loss to the Buckeyes in game three.