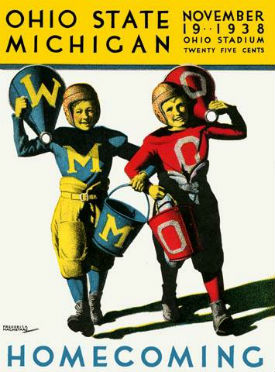
 B1G partying like it's 1938
This week I'll be taking a look at a final new metric for analyzing defensive performance: the Quick Sand score.
Quick Sand can be considered the antithesis of the Quick Strike score - while Quick Strike measures an offense's ability to score points quickly, the Quick Sand measures a defense's ability to "force oponents to run the most plays in order to put points on the scoreboard."
More specifically, it is a measure of opponents' average points per play, or the number of opponent points allowed divided by the total number of defensive plays run. This makes the Quick Sand similar to the Slow Grind, but it also includes special teams plays and total points, rather than just touchdowns:
...this is a team measure. We include all points allowed by a team (including on special teams and via turnover returns)... Bad special teams play and bad offense can obviously impact the yardage a team has to defend and the number of points a team will give up.
The two measures should be highly correlated, however. Once again, my data was all collected from CFB Stats (which is the most useful website in the world) and my data may be accessed here.
Seems legit
As expected, the Quick Sand measure is correlated with both winning and the other defensive measure, the Slow Grind.
| Wins | Coefficient | T | P Value |
|---|---|---|---|
| Quick Sand | -25.49 | -8.92 | 0.000 |
The Quick Sand metric successfully predicts a team’s wins per season too: with 95% confidence we can say that a defense that is able to reduce its average opponent points-per-play by ~.36 is able to win ~1 more game per year.
Further, the top 6 teams Quick Sand teams went 56-24 while the bottom 6 went 32-44 last season.
| Quick Sand | Coefficient | T | P Value |
|---|---|---|---|
| Slow Grind | -.0086 | -13.14 | 0.000 |
Quick Sand is also highly associated with the Slow Grind metric, to the point where it is debatable whether it’s necessary to use both metrics: Over 80% of the variation of the Quick Sand variable may be explained by variation in the Slow Grind variable.
the 2011 season
 Michigan attempting to seize the throne in 2011
Penn State led the way in 2011 with a Quick Sand value of .24 opponent point per play. It actually wasn’t even that close either, with .04 points per play between PSU and the second place team. As a point of reference, the next six teams are all within a .04 points per play range.
Surprisingly, Michigan is the second-place team with a very respectable .28 points per play, followed by Michigan State. I’ve said it before and will (unfortunately) probably have to say it again, but the early returns on new Michigan D-coordinator Greg Mattison are extremely good.
Ohio State was uncharacteristically just 7th place in the conference, comparable to Wisonsin, Iowa, and Nebraska.
the shifting balance of power in the b1g
The same four teams have pretty consistently dominated the Quick Sand rankings: Penn State, Ohio State, Iowa, and (recently) Michigan State.
From 2008-2010 it was all about the big three defenses in the Big Ten - Ohio State (with the lowest average opponent points per play in the conference over this period), Iowa and Penn State. However, the last two years have seen a large shakeup - most notable being Michigan State’s emergence and Michigan’s resurgence.
It’s no real secret that Rich Rod’s defenses were pretty much lost and wandering around in the wilderness for 3 years, but the data really supports this. They finished second to last, fourth from last, and third from last in his three years.
We only have a two-year trend of Michigan State having a dominating defense (equivalent to how long they’ve been relevant), but their defense has been statistically impressive, averaging around .3 opponent points per play (OPPP).
However, Michigan and Michigan State’s recent rise might have more to do with just Ohio State and Iowa falling defensively in 2011 than real and true parity across the entire Big Ten. From 2008-2010 the top two or three teams really separated themselves from the rest of the conference, but there appears to be amazing parity in 2011.
For instance, there’s a .09 OPPP difference between second-place Iowa and third-place Michigan State in 2010, a .1 OPPP difference between third-place Iowa and fourth-place Minnesota in 2009, and a .1 OPPP difference between third-place Penn State and fifth-place Michigan State in 2008. In contrast, the top 80% of the conference is clustered within a .1 Quick Sand score in 2011.
If there’s anything that these past three Stat Sessions have shown us, it’s that 2011 was an awful year statistically for the Buckeyes, as both the offense and defense hit their lowest points (by far) in four years.
The real question here is whether there is true parity between B1G defenses or whether the rightful Kings of the Conference will again separate themselves from the pack in 2012. It’s always difficult to prognosticate, but I’m betting the defensive parity disappears in 2012, with 2011 being an artifact of Ohio State’s (and Iowa’s) unusually poor defense.