Think recruiting rankings don't matter? Well, you're wrong.
Sure the occasional five-star doesn't pan out or the unheralded three-star develops into a first-round NFL Draft pick, but the rankings are more often than not indicative of future success.
"It cracks me up when [people] say the ratings don't matter," Ohio State head coach Urban Meyer said on National Signing Day. "If they're keeping score, we’d like to win that thing. I do look at that. The recruiting services, although they are not 100 percent correct, they’re very close. A lot of those guys that are highly-rated guys turn out to be great players.
“You have the Darron Lees and some other under-the-radar guys that turn out to be phenomenal. The Josh Perrys. But that’s not always going to happen," Meyer continued. "But when you start throwing around numbers like [a 247Sports Composite Ranking of] 94 and five-stars and four-stars, those aren’t the end all, but sure they matter. We’re all competitive. We’re very competitive here. And to say we had one of the historical classes of all time, a lot of hard work went into that.”
Though it finished No. 2 nationally behind only Alabama, winners of seven consecutive recruiting crowns, Ohio State indeed landed one of the best classes of all time. The group of 21 not only includes a nation-high five five-stars and 14 four-stars, its 94.47 per-player average is unmatched.
But no matter how great defensive end Chase Young, linebacker Baron Browning, cornerbacks Jeffrey Okudah and Shaun Wade and quarterback Tate Martell look on paper, this class — like all others — will ultimately be judged by on-field results. Luckily for Ohio State, there's a direct correlation between signing day and conference and national championship races.
Just take a look the average composite score from the last five recruiting cycles:
Atlantic Coast Conference
| Team | Best Class | Worst Class | Average |
|---|---|---|---|
| FLORIDA STATE* | 2 (2016) | 11 (2013) | 5.2 |
| CLEMSON* | 9 (2015) | 17 (2014) | 14.3 |
| MIAMI | 12 (2014) | 26 (2015) | 17.2 |
| VIRGINIA TECH | 21 (2013) | 40 (2016) | 28.4 |
| NORTH CAROLINA | 27 (2017) | 35 (2016) | 29.8 |
| LOUISVILLE | 32 (2015, 2017) | 45 (2014) | 34.8 |
| PITTSBURGH | 30 (2016) | 47 (2015) | 37.2 |
| N.C. STATE | 31 (2015) | 59 (2013) | 44.8 |
| VIRGINIA | 29 (2013) | 63 (2016) | 46 |
| DUKE | 33 (2016) | 70 (2013) | 52.2 |
| GEORGIA TECH | 44 (2015) | 76 (2013) | 56.2 |
| SYRACUSE | 50 (2015) | 73 (2013) | 60 |
| WAKE FOREST | 53 (2015) | 67 (2013) | 62 |
| BOSTON COLLEGE | 52 (2014) | 87 (2013) | 69.4 |
Big XII
| TEAM | BEST CLASS | WORST CLASS | AVERAGE |
|---|---|---|---|
| OKLAHOMA* | 8 (2017) | 19 (2016) | 14.2 |
| TEXAS | 7 (2016) | 26 (2017) | 15.2 |
| BAYLOR* | 26 (2014) | 41 (2016) | 33.8 |
| TCU* | 22 (2016) | 43 (2014) | 34.8 |
| OKLAHOMA STATE | 28 (2014) | 44 (2016) | 35.8 |
| WEST VIRGINIA | 31 (2013) | 57 (2017) | 40 |
| TEXAS TECH | 33 (2015) | 51 (2017) | 43.4 |
| IOWA STATE | 53 (2017) | 66 (2015) | 58.4 |
| KANSAS STATE | 49 (2014) | 75 (2016) | 60 |
| KANSAS | 48 (2013) | 74 (2015) | 62 |
BIG TEN
| TEAM | BEST CLASS | WORST CLASS | aVERAGE |
|---|---|---|---|
| OHIO STATE* | 2 (2013, 2017) | 7 (2015) | 3.6 |
| MICHIGAN | 4 (2013) | 37 (2015) | 14.4 |
| PENN STATE* | 15 (2015, 2017) | 22 (2013) | 21.4 |
| MICHIGAN STATE* | 17 (2016) | 35 (2013) | 26.6 |
| NEBRASKA | 22 (2013) | 36 (2014) | 27 |
| WISCONSIN | 32 (2016) | 40 (2015, 2017) | 36.6 |
| MARYLAND | 18 (2017) | 49 (2015) | 38 |
| NORTHWESTERN | 47 (2014) | 54 (2015) | 50.6 |
| INDIANA | 42 (2013) | 63 (2017) | 52.2 |
| RUTGERS | 42 (2017) | 61 (2016) | 52.4 |
| IOWA | 41 (2017) | 60 (2015) | 53 |
| ILLINOIS | 43 (2017) | 72 (2014, 2016) | 56.8 |
| MINNESOTA | 46 (2016) | 66 (2013) | 58 |
| PURDUE | 62 (2013) | 80 (2016) | 69.4 |
PAC-12
| TEAM | BEST CLASS | WORST CLASS | AVERAGE |
|---|---|---|---|
| USC | 2 (2015) | 13 (2013) | 7.8 |
| UCLA | 7 (2013) | 20 (2017) | 14 |
| OREGON* | 16 (2015) | 27 (2016) | 20.4 |
| STANFORD* | 13 (2014) | 51 (2013) | 23.6 |
| WASHINGTON* | 18 (2013) | 37 (2014) | 26.6 |
| ARIZONA STATE | 20 (2015) | 39 (2013) | 29 |
| ARIZONA | 30 (2014) | 50 (2016) | 42.4 |
| CALIFORNIA | 31 (2016) | 70 (2017) | 45.8 |
| UTAH | 36 (2017) | 67 (2014) | 46.4 |
| WASHINGTON STATE | 41 (2015) | 57 (2016) | 50.2 |
| OREGON STATE | 45 (2013) | 63 (2014) | 54.4 |
| COLORADO | 35 (2017) | 74 (2014) | 63 |
SEC
| TEAM | BEST CLASS | WORST CLASS | AVERAGE |
|---|---|---|---|
| ALABAMA* | 1 (2013-17) | -- | 1 |
| LSU | 2 (2014) | 7 (2017) | 4.8 |
| GEORGIA | 3 (2017) | 12 (2013) | 7.2 |
| AUBURN* | 6 (2014) | 10 (2013) | 8.4 |
| FLORIDA | 3 (2013) | 21 (2015) | 11 |
| TEXAS A&M | 5 (2014) | 18 (2016) | 11 |
| TENNESSEE | 4 (2015) | 24 (2013) | 13.2 |
| MISSISSIPPI | 5 (2016) | 30 (2017) | 15 |
| SOUTH CAROLINA | 19 (2014-15) | 25 (2016) | 20.8 |
| ARKANSAS | 23 (2013, 2015-16) | 29 (2014) | 25.2 |
| MISSISSIPPI STATE | 18 (2015) | 35 (2014) | 26 |
| KENTUCKY | 22 (2014) | 38 (2015) | 31.4 |
| MISSOURI | 25 (2015) | 50 (2017) | 40 |
| VANDERBILT | 26 (2013) | 64 (2017) | 47 |
NATIONAL RANKINGS
| TEAM | AVERAGE |
|---|---|
| ALABAMA** | 1 |
| OHIO STATE** | 3.6 |
| LSU | 4.8 |
| FLORIDA STATE** | 5.2 |
| GEORGIA | 7.2 |
| USC | 7.8 |
| AUBURN | 8.4 |
| FLORIDA | 11 |
| TEXAS A&M | 11 |
| TENNESSEE | 13.2 |
| UCLA | 14 |
| OKLAHOMA | 14.2 |
| CLEMSON** | 14.3 |
| MICHIGAN | 14.4 |
| MISSISSIPPI | 15 |
*Conference Champion **National Champion
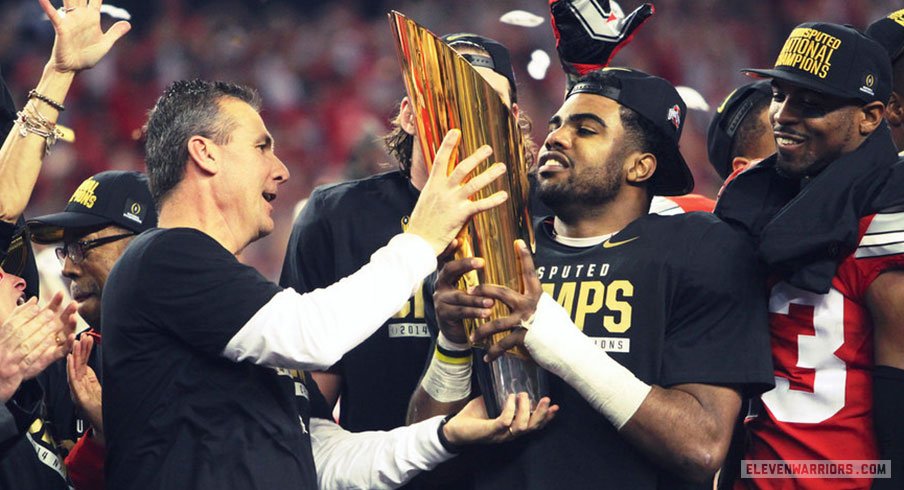
There are a few notable outliers, of course, such as Washington's run to the College Football Playoff and Texas' abysmal record under Charlie Strong. But in the end, it's easy to see why recruiting rankings matter.
Three of the last four national champions have an average finish in the Top 5 nationally, while the other finished in the Top 15. Simply put, if you recruit at an elite level, you're almost guaranteed to have an elite team.