 The most coveted award in sports!
Heading into 2012, the Big Ten is set to have nine returning starters under center. While the Leaders and Legends will never be mistaken for pass-happy conferences like the Big 12 or Pac 12, there are a few players of the Midwestern ilk who can sling it around from time to time.
As much as it pains me to admit, Denard (hold up, I’m gonna go ahead and throw an interception real quick) Robinson is widely regarded as the best rushing QB in the conference (at least for now...lookin at you #5). But who is the best pure passer?
In an effort to discern exactly that, I’ve developed what I've named the Jeff Pure Passer Scale or JPPS (humor me…it’s the offseason and its always been a dream of mine to have a metric named after me).
Methodology
The JPPS is an analytic used to compare the success (or lackthereof) of two or more QBs. It assumes all major passing statistics (Comp %, Yds, TD, INT, and Average YDS per pass) are weighted equally.
For my comparison, I started with the 2012 Big Ten Projected Starters and narrowed them to a top five based on NCAA Passer Efficiency Ratings. Players attempting less than 100 passes were not eligible. Those five players were:
| Rank | Name | 2011 Efficiency Rating |
|---|---|---|
| 1 | Denard Robinson | 139.7 |
| 2 | James Vandenberg | 138.5 |
| 3 | Braxton Miller | 138.4 |
| 4 | Nathan Scheelhaase | 133.4 |
| 5 | Caleb TerBush | 130.7 |
Players were then ranked highest to lowest for every major statistic listed above and given points based on where they ranked for each stat. For instance:
2011 Total Passing Yards
| Rank | Name | 2011 YDS | Points |
|---|---|---|---|
| 1 | James Vandenberg | 3,022 | +5 |
| 2 | Denard Robinson | 2,173 | +4 |
| 3 | Nathan Scheelhaase | 2,110 | +3 |
| 4 | Caleb TerBush | 1,905 | +2 |
| 5 | Braxton Miller | 1,159 | +1 |
As you can see, James Vandenberg was given 5 points because he had the highest number of yards out of the five players. Point totals go down by one as you move down each place on the list.
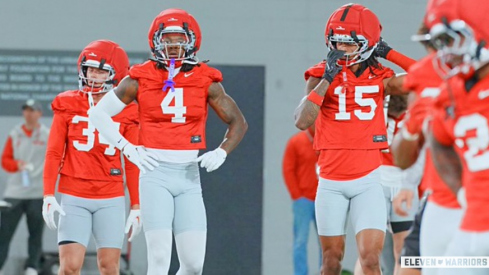
 Brax trying to raise his JPPS.
Seem pretty straightforward? Good because there’s more. For interceptions, players were given negative points (cuz throwin the ball to the other team aint good). The player at the top of the list was given -5, the next was given -4 and so on.
Finally, if players tied in category totals, the players with the same totals were awarded the same amount of points. However the player(s) below the knotted up individuals were still awarded the point total they would have received had the players not tied. For instance:
2011 Average Yards Per Pass
| Rank | Name | 2011 Avg Yds Per Pass | Points |
|---|---|---|---|
| 1 | Denard Robinson | 8.4 | +5 |
| Tied for 2 | James Vandenberg | 7.9 | +4 |
| Tied for 2 | Braxton Miller | 7.9 | +4 |
| 4 | Nathan Scheelhaase | 7.3 | +2 |
| 5 | Caleb TerBush | 6.9 | +1 |
The sum of a player's points for every category = that player’s JPPS. With that said, let's take a look at how it all shook out.
2011 JPPS Standings
| Name | Completion % | YDS | TD | INT | AVG Yds Per Attempt | JPPS |
|---|---|---|---|---|---|---|
| James Vandenberg | +3 | +5 | +5 | -3 | +4 | 14 |
| Denard Robinson | +2 | +4 | +4 | -5 | +5 | 10 |
| Nathan Scheelhaase | +5 | +3 | +3 | -4 | +2 | 9 |
| Braxton Miller | +1 | +1 | +3 | -1 | +4 | 8 |
| Caleb TerBush | +4 | +2 | +1 | -2 | +1 | 6 |
Drum roll please....the inaugural JPPS trophy (and orange slices) go to James Vandenberg. He led in two of the five categories (YDS and TD) and was second in another (Avg YDS Per Attempt). Unlike Denard (can I get an arm punt?) Robinson, his INT total wasn't high enough to drag him down the list.
In 2009 as a redshirt Freshman, Vandenberg showed flashes of brilliance almost denying the Buckeyes a trip to the Rose Bowl. In 2011, his first full season as a starter, Vandenberg threw for over 3,000 yards and 25 TDs. There's no denying he can toss it around. His favorite target Marvin McNutt is gone, but stepping in is Keenan Davis who had 50 receptions for 713 yards and 4 TDs last season. Vandenberg's mobility is limited, but if given enough time in the pocket, he'll find a receiver.
As for our man Braxton, he ended up second to last in terms of JPPS. While Miller's passing game definitely needs work, it's safe to say his rank is more a symptom of last year's train wreck of an offense and less a true barometer of his talents. I expect his JPPS to be much higher by the end of the 2012 season.
So there you have it. Only time will tell if JPPS is an accurate gauge of a QB's pure passing abilities, but hey, that's half the fun...right?