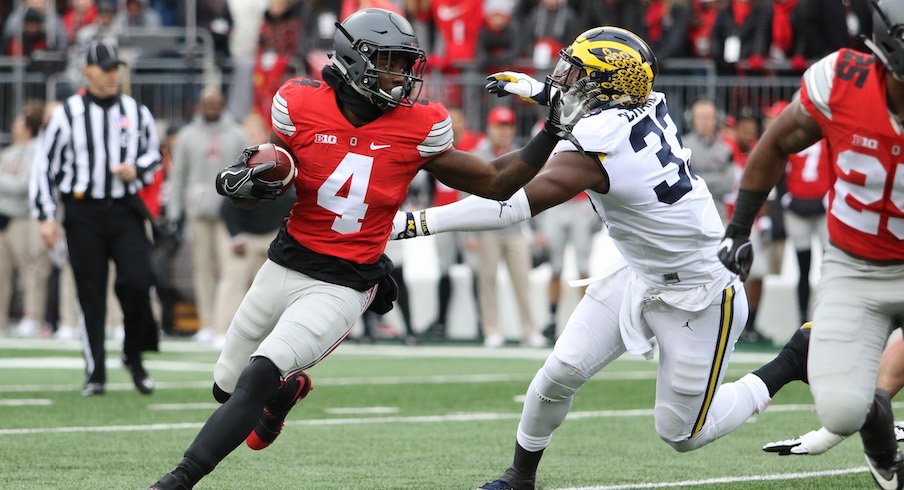
Everyone knows Ohio State is DBU.
This revelation has been proved many times, most recently by the program itself in this tweet:
https://t.co/iPdL1wOKpR pic.twitter.com/55bm8jcue1
— Ohio State Football (@OhioStateFB) October 11, 2019
While the Buckeyes’ dominance in pass defense at the next level is well-documented, relatively little is said about the school’s success at the wideout position in the NFL.
Ohio State currently has six wide receivers in the NFL that have caught a pass this season, the second-most of any school in the nation. Those receivers include Ted Ginn Jr., Devin Smith, Michael Thomas, Curtis Samuel, Parris Campbell, and Terry McLaurin. Noah Brown is on the Cowboys, but has yet to catch a pass this season and has been on the PUP list.
Putting six receivers in the NFL is impressive enough, but what sets Ohio State apart is the success those players have had at the next level. Michael Thomas is one of the best wideouts in the game and recently signed one of the most lucrative extensions in his position's history. Terry McLaurin is a rising young star that is already setting NFL records. Curtis Samuel is a weapon from all over the field and is having the best year of his young career.
When aggregating the wideouts who donned the scarlet-and-gray and comparing them to other schools across the nation, the Buckeyes are at the top of the list in nearly every category. Ohio State products are leading the pack with 1,432 yards, are second with 10 TDs, and catch over 68% percent of their targets.
| Metric | National Rank |
|---|---|
| Receiving Yards | 1st |
| Touchdowns | 2nd |
| Receptions | 1st |
| Catch Rate* | 7th |
While these numbers give us a basic sense of how the Buckeyes are faring in the NFL, they do not tell us the whole story. Touchdowns are mostly a random statistic and are difficult to predict. For this reason and a couple of others, we turn to more advanced measures.
Using data from nflscrapR, the free, leading package for advanced NFL analytics, AirYards.com, and ESPN, we can account for different factors and use more robust statistics.
The main statistic used is expected points added (EPA) and success rate. As described in previous pieces, expected points added can be an extremely useful measure because it is based on a simple concept: not all yards are created equal. Gaining two yards to convert on third down just outside of the red zone is a lot better than gaining two yards on first-and-ten in your own territory.
It is important to note that EPA can:
- Be negative: if you lose yards on a play, you will likely lose expected points.
- Be greater than seven: if you start a play with negative expected points and finish it in the end zone, you have contributed greater than seven expected points.
- Be less than negative seven: red zone pick sixes hurt.
On a similar note, success rate is the percentage of plays that result in positive expected points added. A successful play can most easily be thought of as converting a first down, scoring a touchdown, or gaining five-or-more yards on first or second down.
These statistics are much more robust than traditional yardage measures and receptions; they take into account the position on the field, the score, the down-and-distance, and much more in order to create a valuable number.
When using these statistics to judge how Ohio State products compare to the rest of the field, the Bucks jump to the top once again. By aggregating all NFL players back to their collegiate programs and adding up their total expected points, we now have a number that tells us how productive each school's alumni is in the NFL. A similar process was done for the mean success rate of each school's receivers in the league.
| Metric | National Rank |
|---|---|
| Total EPA | 2nd |
| Success Rate | 16th |
| EPA/Target | 12th |
| Average Depth of Target | 7th |
A slight flaw, however, does exist. As of now, we have only measured the total EPA and mean success rate based on the totals, meaning Ohio State, with six receivers, will be at the top of most of the tables. The total number of Buckeyes should be a factor in declaring who is WRU, of course, but the opportunities that each school receives, which will be calculated as receiver targets, should also matter.
To check how opportunity and production compare, let's take a look at each school's total expected points added versus the total number of targets that each school's wideouts have received.

For reference, a school above the blue curve is above the average at that point. Ohio State is not only far above the regression line at its point, it is also the most "top-right-most" program, making it one of the best schools in the nation when considering both the production and opportunity of its alumni in the NFL.
Despite this, however, it is difficult to deny Alabama's claim to the throne. Nick Saban may not have has many receivers in the NFL as the Buckeyes, but his group is among the best in the league. Alabama's total EPA is the best in the nation and the school's four wideouts are among the best in the league.
With players like Michael Thomas and Terry McLaurin, there is no question that Ohio State deserves to be in the conversation as WRU. While the Buckeyes may not be able to claim the throne just yet, the future is looking bright; the Buckeyes have one of the best receiving corps in the nation and are bringing in some of the best recruits in the country for the next few years.


