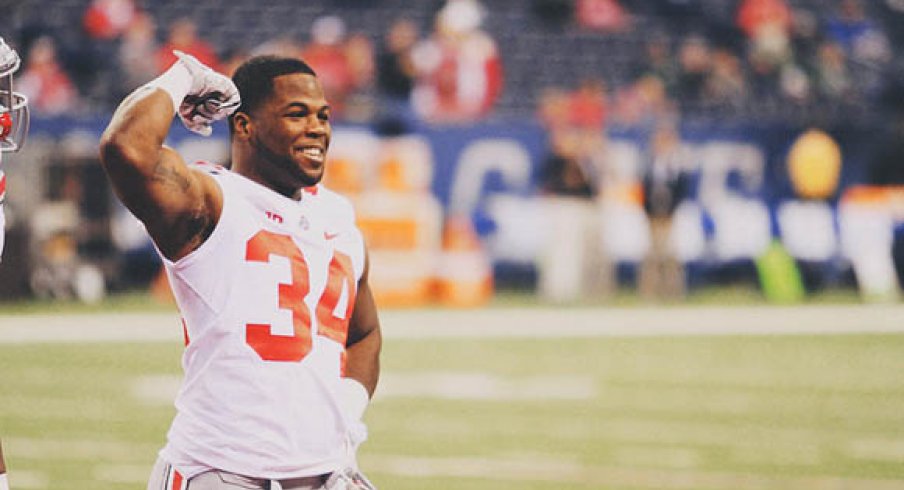
It didn't take a mathematician to spot Carlos Hyde's talent in his monster 2013 season, but Greg Peshek of Rotoworld.com crunched some numbers, and SURPRISE, the numbers back up what our eyes told us (for the most part).
Here's how Carlos' numbers broke down compared to LSU's Jeremy Hill, Auburn's Tre Mason, Baylor's Lache Seastrunk and Washington's Bishop Sankey.
EXTRA YARDS. As Peshek explains, Extra Yd "represents an aggregate score combining yards after contact capped for 15 yards and broken tackles as a function of total carries. The score is capped at 100 and an average score is around a 65."
| Hyde | Hill | Mason | Sankey | Seastrunk | |
|---|---|---|---|---|---|
| EXTRA YD | 83.72 | 81.99 | 66.05 | 52.85 | 80.06 |
| YARDS AFTER CONTACT | 3.48 | 2.93 | 2.78 | 2.45 | 2.89 |
| BROKEN TACKLE % | 7.92% | 8.59% | 6.19% | 4.56% | 8.33% |
Not bad numbers from Carlos, whose numbers back-up his status as a power-back.
DEFENSES FACED. Here's how Pashek broke down this category: "In charting each play I counted the number of blockers and personnel in the box at the beginning of each play. In doing so, we can create a ‘blocker differential’ or how many defenders there are compared to blockers. In the chart below, -1 represents one more defender in the box than blocker, 0 represents an even number of defenders and blockers, and so on. The values for each category are YPC. If there were not enough carries for the differential, they were left blank."
| Diff -2 | Diff -1 | Diff 0 | Diff +1 | |
|---|---|---|---|---|
| Hyde | 2.50 | 6.78 | 9.19 | - |
| Hill | - | 7.27 | 7.16 | 4.44 |
| Mason | 3.27 | 6.49 | 4.99 | 7.87 |
| Sankey | 3.71 | 6.15 | 6.70 | 6.11 |
| Seastrunk | - | 4.76 | 8.32 | - |
Interesting enough, the numbers say Carlos Hyde struggled against stacked boxes in short yardage situations. Peshek notes while Carlos is good in yards after contact, his struggles against stacked boxes "raises questions about which part of his game will translate to the NFL."
Carlos definitely saw more stacked boxes than Hill and Seastrunk, as there wasn't even enough data to plot their -2 differential. Interestingly, Sankey, whose yards after contact numbers were the worst of the bunch, posts good numbers here. So does Auburn's Tre Mason but he plays in an offense with a lot of window dressing/misdirection.
SHORT YARDAGE SITUATIONS. Peshek explains this category thusly: "3rd Down % is the rate at which the RB converted 3rd and short situations. Goal to go is the yards per carry in goal line situations."
| Hyde | Hill | Mason | Sankey | Seastrunk | |
|---|---|---|---|---|---|
| 3rd Down % | 75% | 85.71% | 92.31% | 78.79% | 70.00% |
| Goal-to-Go % | 2.71 | 3.53 | 3.06 | 2.61 | - |
This set of numbers was the most shocking to me. I thought 75% on 3rd down was massive, until I saw Jeremy Hill posted a 85.71% clip and Mason posted a 92.31% clip.
This is where I would like to see the quantity involved in these numbers. How many times was Carlos Hyde ran in a 3rd down situation compared to Jeremy Hill and Tre Mason?
RUNS BY YARDS PER CARRY. Peshek says this category "shows the percentage of runs by yardage gained. It should give you a feel for whether a back was getting stopped short often or breaking off solid long runs regularly. It’s a bit less pronounced with this group, but in the second group we’ll see backs with much higher percentages of short runs."
| Hyde | Hill | Mason | Sankey | Seastrunk | |
|---|---|---|---|---|---|
| < 4 Yards | 36.14% | 41.41% | 41.69% | 43.86% | 40.38% |
| 4-20 Yards | 58.42% | 53.54% | 55.70% | 48.77% | 53.85% |
| 20+ Yards | 5.45% | 5.05% | 2.61% | 7.37% | 5.77% |
Here, Carlos Hyde shows 1) he doesn't go down easily and 2) he has a surprising number of big yardage runs.
Now, these stats aren't perfect. One gripe I have is Carlos' three-game suspension. (He also only logged five carries against FAMU.)
Jeremy Hill was suspended for the LSU-TCU opener, but everyone else played a full 13 games. Carlos never got to play the likes of Wofford, Western Carolina, Idaho State or Kent State. He came in during conference play and was still the most consistent weapon the Buckeyes had all year.