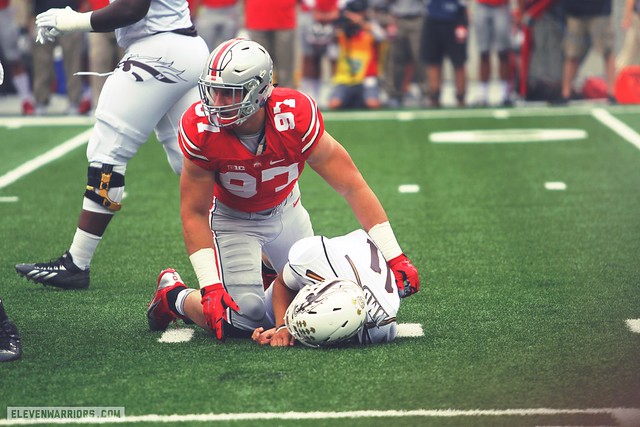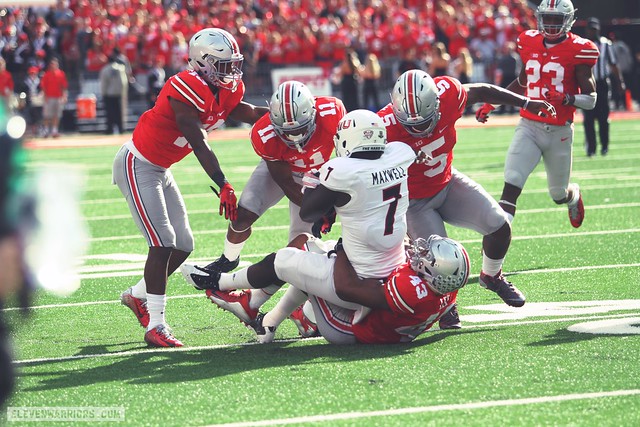
This miniseries will look at Ohio State's effect on its opponents through the first 10 weeks of the season. It's always interesting to see if there are any trends in Ohio State's play. Tonight we will look at the effect the Silver Bullets had on their opponent's total points scored and total yards gained.
Below you will see what Ohio State's defense has done to opponents and their Points Scored stats in 2015. The teams are listed in the order the Buckeyes played them.
Note:
Negative (-) numbers are good for Ohio State.
Positive (+) numbers are bad for Ohio State.
3 Things Opponent's Points Scored
- Ohio State had the largest difference against Northern Illinois (- 34.5) and Hawai'i (- 28.0). The Huskies had the 14th ranked Points Scored offfense and left with the 41st best after facing Ohio State's defense.
- Maryland's offense scored the most against the Buckeyes' defense (28) and is the only offense to score more than their season average.
- If you like to predict scores, Ohio State's defense is holding opponents to 46% their season average.
| TEAM | AVG. BEFORE OHIO STATE | POINTS SCORED AGAINST OHIO STATE | DIFFERENCE | RANK BEFORE | RANK AFTER |
|---|---|---|---|---|---|
| VIRGINIA TECH | 24.1* | 24 | - 0.1 | ||
| HAWAI'I | 28.0 | 0 | - 28.0 | 74th | 118th |
| NORTHERN ILLINOIS | 47.5 | 13 | - 34.5 | 14th | 41st |
| WESTERN MICHIGAN | 31.0 | 12 | - 19.0 | 63rd | 87th |
| INDIANA | 38.3 | 27 | - 11.3 | 30th | 34th |
| MARYLAND | 23.6 | 28 | + 4.4 | 99th | 98th |
| PENN STATE | 25.2 | 10 | - 15.2 | 92nd | 103rd |
| RUTGERS | 34.3 | 7 | - 27.3 | 40th | 59th |
| MINNESOTA | 21.1 | 14 | - 7.1 | 107th | 112th |
| ILLINOIS | 25.8 | 3 | - 22.8 | 91st | 99th |
| AVERAGE | 29.9 | 13.8 | - 16.1 | 68th | 83rd |
*2014 Average

| TEAM | SEASON AVG. WITHOUT OHIO STATE | POINTS SCORED AGAINST OHIO STATE | DIFFERENCE |
|---|---|---|---|
| VIRGINIA TECH | 30.4 | 24 | - 6.4 |
| HAWAI'I | 17.8 | 0 | - 17.8 |
| NORTHERN ILLINOIS | 39.3 | 13 | - 26.3 |
| WESTERN MICHIGAN | 39.7 | 12 | - 27.7 |
| INDIANA | 34.0 | 27 | - 7.0 |
| MARYLAND | 21.6 | 28 | + 6.4 |
| PENN STATE | 26.9 | 10 | - 16.9 |
| RUTGERS | 27.3 | 7 | - 20.3 |
| MINNESOTA | 22.7 | 14 | - 8.7 |
| ILLINOIS | 25.8 | 3 | - 22.8 |
| AVERAGE | 28.6 | 13.8 | - 14.8 |
To this point, Ohio State's defense has held opposing offenses to 13.8 points per game. Six times this season the Silver Bullets have held opponents to double digits below their season points scored average.
Defense wins championships. If the Buckeyes' continue to limit opponents to under 14 points per game a second title should belong to Ohio State.
Below you will see what Ohio State's defense has done to opponents and their Offensive Total Yards stats in 2015. The teams are listed in the order the Buckeyes played them.
Note:
Negative (-) numbers are good for Ohio State.
Positive (+) numbers are bad for Ohio State.
3 Things Opponent's Offensive Total Yards Stats
- Ohio State had the largest difference against Northern Illinois (- 304.0) and Rutgers (- 155.8).
- The Silver Bullets held 90 percent of Ohio State's opponents under their season total yards average.
- If the average holds true you can expect teams to gain just under 100 yards less than their season average against Ohio State.
| TEAM | AVG. BEFORE OHIO STATE | TOTAL YARDS AGAINST OHIO STATE | DIFFERENCE | RANK BEFORE | RANK AFTER |
|---|---|---|---|---|---|
| VIRGINIA TECH | 365.3* | 320 | - 45.3 | ||
| HAWAI'I | 302.0 | 165 | -137.0 | 106th | 125th |
| NORTHERN ILLINOIS | 494.0 | 190 | -304.0 | 7th | 43rd |
| WESTERN MICHIGAN | 421.0 | 338 | -83.0 | 66th | 78th |
| INDIANA | 522.3 | 402 | - 120.3 | 18th | 19th |
| MARYLAND | 332.4 | 386 | + 53.6 | 114th | 109th |
| PENN STATE | 344.3 | 315 | - 29.3 | 103rd | 111th |
| RUTGERS | 448.8 | 293 | - 155.8 | 34th | 46th |
| MINNESOTA | 364.8 | 314 | - 50.8 | 93rd | 102nd |
| ILLINOIS | 384.3 | 261 | - 123.3 | 78th | 86th |
| AVERAGE | 397.9 | 298.4 | - 99.5 | 69th | 80th |
*2014 Average

| TEAM | SEASON AVG. WITHOUT OHIO STATE | TOTAL YARDS AGAINST OHIO STATE | DIFFERENCE |
|---|---|---|---|
| VIRGINIA TECH | 375.8 | 320 | - 55.8 |
| HAWAI'I | 317.6 | 165 | - 152.6 |
| NORTHERN ILLINOIS | 480.2 | 190 | - 290.2 |
| WESTERN MICHIGAN | 502.3 | 338 | - 164.3 |
| INDIANA | 474.8 | 402 | - 72.8 |
| MARYLAND | 330.4 | 386 | - 55.6 |
| PENN STATE | 354.6 | 315 | - 39.6 |
| RUTGERS | 371.3 | 293 | - 78.3 |
| MINNESOTA | 351.7 | 314 | - 37.7 |
| ILLINOIS | 384.3 | 261 | - 123.3 |
| AVERAGE | 394.3 | 298.4 | - 95.9 |
To this point, Ohio State's defense has held opposing offenses to 298.4 total yards per game. Every game this season the Silver Bullets have held opponents to double digits below their season total yards average.
It has to be a disheartening for an opposing offense to come into the game knowing that they are going to gain close to 100 yards less yards than they normally do. If the Buckeyes can start winning the turnover margin their chances for a repeat greatly improve.
This Week's Articles
Ten Weeks Of The Ohio State Effect: Defensive Rushing Yards and Defensive Passing Yards
Ten Weeks Of The Ohio State Effect: Defensive Total Points and Defensive Yards Allowed
The Rundown: No. 9 Michigan State at No. 3 Ohio State
The Series History: Michigan State
