Welcome to the Urban era. We've already witnessed maybe the catch of the year, a quarterback who threw for over 200 and ran for over 160, and a defense that managed to force -1 rushing yards.
 Meyer is pleased with the stats this week
 In this Stat Session reborn, I'll be taking a look at the numbers behind the game and providing numerical context for what you saw the previous day.
Throughout the season I'll track relevant and interesting statistical trends using metrics that provide a more thorough description of the team's performance.
I'll update these numbers each week and compare these against season and career averages as well.
Yep, that means that you get to see your old friends Quick Strike and Quick Sand, as well as a few new measures that I've been working on.
offense
The offense started the Meyer era off with a whimper, punting on all four first-quarter series. Then things started rolling, giving us some interesting numbers to look at:
In particular, Meyer achieved his goal of a balanced offensive attack, with 244 passing and 294 rushing yards. I'm sure he was also pleased to not have any turnovers, though Braxton made an excellent recovery of his own fumble. The team limited penalties as well, with only one false start (even though it was still at right tackle!).
| 1st downs | 3rd down conv | 4th down conv | Total Yards | Passing | Rushing | Turnovers | Penalties | QuickStrike | Sacks |
|---|---|---|---|---|---|---|---|---|---|
| 27 | 53% | 100% | 538 | 244 | 294 | 0 | 3-20 | .659 | 4 |
So far the team ranks 45th in passing yards, 14th in rushing yards, and 9th in total points after one weekend of play - a remarkable difference from last season (even though this is only after a week of play against a cupcake opponent).
The offensive line also gave up four sacks, though I was fairly happy with the line play throughout the day. It's difficult to say how much of that was the quality of the opponent, but Braxton generally had quite a bit of time to find receivers.
I also calculated the "Quick Strike" metric:
Take a team’s total number of points scored. Divide that number by the number of plays an offense runs… and there’s your points-per-play ratio, your Quick Strike number.
This means that the Ohio State offense had .659 points per play (!) against Miami, an absurdly good number. That's even with 85 plays in the denominator! For some context, the 2011 Buckeyes averaged .394 points per play last year - a 67% increase today.
The Clock. Speaking of number of plays run, the Ohio State offense hit 85 (!!) total plays run from scrimmage against Miami, indicative of extensive no-huddle.
| Time of possession | Last year Top | # of plays | last year # of plays |
|---|---|---|---|
| 31:26 | 30:40 | 85 | 62 |
Many were worried that the no-huddle would mean that the offense wouldn't control the clock any more, never giving the defense a rest, but it's clear that isn't so based on yesterday's performance. The offense had the ball for slightly more than half of the game, while running 23 more plays than last year's average.
The offense's quick pace allowed for far more plays while still controlling the clock through an efficient running game. It's also important to realize that the offense would have had the ball longer if hadn't gone 3-and-out on the first four series.
defense
The following chart captures defensive performance and the opponent's offense:
| Opp 1st down | opp total Yards | opp pass | opp rush | opp turnovers | Opp ToP | Sacks | 3&Outs | OppRBSR | QuickSand |
|---|---|---|---|---|---|---|---|---|---|
| 12 | 312 | 313 | -1 | 3 | 28:34 | 2 | 5 | 27% | .13333 |
The "OPPRBSR" column stands for "opponent running back success rate", a measure of rushing efficiency that is detailed further below. Essentially, it can be interpreted that the defense forced 73% of Miami's rushes to be "inefficient" or failures. With -1 rushing yards, it was clear that Miami could only have any success through the air yesterday.
You should be somewhat familiar with the Quick Sand metric already, but it is a measure of points per defensive play:
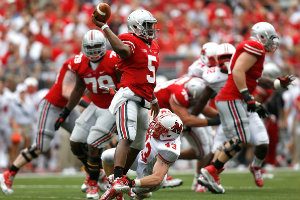 Braxton showcased an improved passing attack
Quick Sand measures a defense's ability to "force opponents to run the most plays in order to put points on the scoreboard." More specifically, it is a measure of opponents' average points per play, or the number of opponent points allowed divided by the total number of defensive plays run.
The .1333 is obviously far different than the Ohio State offense, meaning that though Miami gained a lot of yards through the air and ran a lot of plays, very few of those plays produced actual points.
Another interesting note is that Spence and Washington - the two freshmen hot shot defensive linemen - were the two defensive players to record a sack yesterday. I believe that the defense would have had significantly more, but Miami's quick passing attack neutralized the pass rush more effectively.
player analysis
Braxton and Kenny G. Braxton continued his recent trend of improved passing since the Michigan game, with 14 of his 25 passing attempts as either catchable or dead-on throws. His completion percentage is up from his career average of 54%, with a 20-point boost in QB rating too.
| QB | att/cmp | comp % | Yards | td | int | rating |
|---|---|---|---|---|---|---|
| Braxton Miller | 14/24 | 58.3 | 207 | 2 | 0 | 152 |
| Kenny Guiton | 5/9 | 55.6 | 36 | 0 | 0 | 89.2 |
| qb | into coverage | uncatchable | throw away | difficult | catchable | dead on |
|---|---|---|---|---|---|---|
| Braxton | 1 | 3 | 1 | 5 | 7 | 7 |
| Guiton | N/A | 2 | 1 | N/A | 5 | 1 |
It's true that Braxton was not throwing against Alabama's secondary, but the unquantifiable aspects of his passing were far better. While receivers sometimes have to slow down for a pass or wait in open zones, Braxton's decision-making was improved. He's hurt by several inexplicable drops at the beginning of the game.
While the throw chart is based on my own judgment and Braxton had several passes that were errant or behind receivers, his decision-making and ability to scan the field was clearly improved.
It's clear that having a live, functioning quarterback coach is vastly helping his decision-making, accuracy, and ability to read the defense. Several of his "difficult to catch" passes include a pass break-up, Devin Smith's amazing one-handed catch, and a bad spiral that got away from a receiver.
Also interesting is that even though Braxton said last week that his ideal number of passes per game was approximately 20, he had 21 already in the first half! Clearly Meyer wanted to get some more passing practice time in against a live opponent.
Running Backs. Because seemingly half of the team got a carry or two yesterday, this is a good week to introduce a metric from Football Outsiders called the Running Back Success Rate. This metric allows us to gauge a running back's effectiveness far better than a simple yards per carry average because of how easily skewed YPC is by big plays.
For instance, imagine a running back that has 5 carries for 100 yards. Good game, right? But what if that running back broke one play for 96 yards, and then averaged a single YPC on his other four? That certainly tells a different story. The RBSR attempts to capture how well the running back can pick up first downs and
...represents the player's consistency, measured by successful running plays (the definition of success being different based on down and distance) divided by total running plays.
In general, a play counts as a "hit" if it gains 40% of yards on first down, 60% of yards on second down, and 100% of yards on third down. If the team is behind by more than a touchdown in the fourth quarter, the benchmarks switch to 50%/65%/100%. If the team is ahead by any amount in the fourth quarter, the benchmarks switch to 30%/50%/100%.
Additionally, in an effort to appraise the value of big play vs. grind it out running backs, I calculated yards per carry after subtracting "explosive plays", which I defined as plays that go for greater than 15 yards. Braxton took it to the house (and got close several more times), but how did he do on his non-big plays? Related, I also list the percentage of rushes that the back took for more than 15 yards.
| Rusher | att | total yards | yPC | RBSR | YPC -Explosive Plays | Explosive play potential |
|---|---|---|---|---|---|---|
| Hyde | 16 | 82 | 4.8 | 53% | 4.4 (16) | 1/16 |
| Braxton | 17 | 163 | 10.2 | 53% | 2.2 (17,33,22,65) | 4/17 |
| Dunn | 7 | 32 | 4.6 | 86% | 4.6 | - |
| Guiton | 17 | 14 | 2.8 | 75% | 2.8 | - |
| Boren | 5 | 10 | 5 | 100% | 5 | - |
| R. Smith | 2 | 17 | 5.7 | 66.7% | 5.7 | - |
All of the running backs had great days against Miami, with Hyde displaying elite toughness (crazy yards after contact!) and Braxton adding to his growing collection of YouTube fan-made highlight video runs.
A couple of things about this chart:
1. Every single runner on the team had a good day against Miami. When your team averages ~5 yards per carry even after removing an outlier rusher (Braxton with 10.2), then you know that you had a good game on the ground.
2. Even though Hyde and Braxton led the way in total yards and number of carries, their Running Back Success Rates mean that only 53% of their carries were "successful" or efficient carries.
This is simply because they had more carries than the other backs (and more opportunities for "failure plays") and because Dunn, Guiton, and Rod Smith were all receiving the majority of their carries late in the fourth quarter when both sides had subbed out their first team. Regardless, these are great numbers.
3. It's clear that the team's home-run threat on the ground is Braxton, at least until Hall gets back. 4 of his 17 carries went for more than 15 yards - close to 25%! Keeping with that division between Braxton's explosive speed and Hyde's grind-it-out toughness is how significantly Braxton's YPC drops after removing his big explosive runs.
It's important to point out that removing those runs doesn't mean they weren't important; instead, it just reinforces that the two rushers - Hyde and Braxton - served different purposes against Miami. Using the RBSR, we see that they tied each other in efficient rushes, so both players were able to move the ball efficiently, even when taking game context into the equation.
It will be interesting to watch the offense develop with a "scatback" at quarterback and the running backs as power backs - different than any other combination of backs that Meyer has had before.
Finally, I'd be terribly mistaken if I didn't give a shout-out to Zach Boren, who tripled his career carries today and averaged five yards a carry. He looked every bit of the slim and powerful runner we had heard about in practice. That's not to mention his devastating blocks all day, which included his block of the safety on Braxton's 65-yard touchdown run off of the zone-read option.
Wide Receivers. This chart attempts to capture the number of targets and catches as well as reward receivers that make spectacular catches and punish those that miss "dead-on" throws. The "+" means that Devin Smith had a catch of the year, while the minuses were all early-game misses that hit the receivers in the hands.
| Receiver | yards | catch rate | +/- |
|---|---|---|---|
| Evan Spencer | 54 | 3/6 | - |
| D. Smith | 31 | 2/4 | -, + |
| Stoneburner | 28 | 2/4 | |
| Philly Brown | 87 | 7/9 | |
| Boren | 18 | 2/3 | - |
| Vannett | 13 | 2/2 | |
| Reed | 12 | 1/1 |
In particular, it's good to see Philly Brown have such a successful game. With nine targets and seven catches, it certainly looked like Braxton had developed a strong rapport with Philly, and that he's worked hard at curing his dropsies.
It's also the mark of an improved passing attack when seven players show up in the receiving column, including 5 receivers, 1 tight end, and 1 running/full back.
Defense. Shazier led the way for the Buckeyes with 8 tackles. The Miami passing game produced big days for the starting corners, with Roby totaling six tackles, two pass breakups, and a fumble recovery for a touchdown. Opposite Roby, Howard Island actually came through with 2 interceptions on the day. His two interceptions were the first multi-interception day by a single defender since Chekwa vs. Miami (FL) in 2010.
Complete Game Coverage
While Miami quarterback Dysert did pass for over 300 yards, I think the pass defense will get better, and I think the safeties and STARs have a bit of work to do. They blew several assignments that resulted in large first-half gains for the Miami offense.
As mentioned, Spence and Washington led the way with sacks, though John Simon was relentless all day and narrowly missed banking some stats several times. The defensive line will pick up better numbers against different types of offenses.
I was also impressed with Sabino, who had some seriously painful-looking hits, as well as Shazier, Christian Bryant, and Roby.