Last week, we presented a graphic that showed the distance between each player’s hometown and their respective B1G campus. Several commenters wanted to see how Ohio State recruiting classes have changed throughout the years and we thought to ourselves: Let’s do it.
First up is an animated GIF highlighting these changes through the years:

Using data back going back to 1974 (provide by Eleven Warriors), we created each year’s spread and then combined them into an animation to observe how the recruiting behavior has changed. Note that each year only contains the recruits committed to OSU for that year.
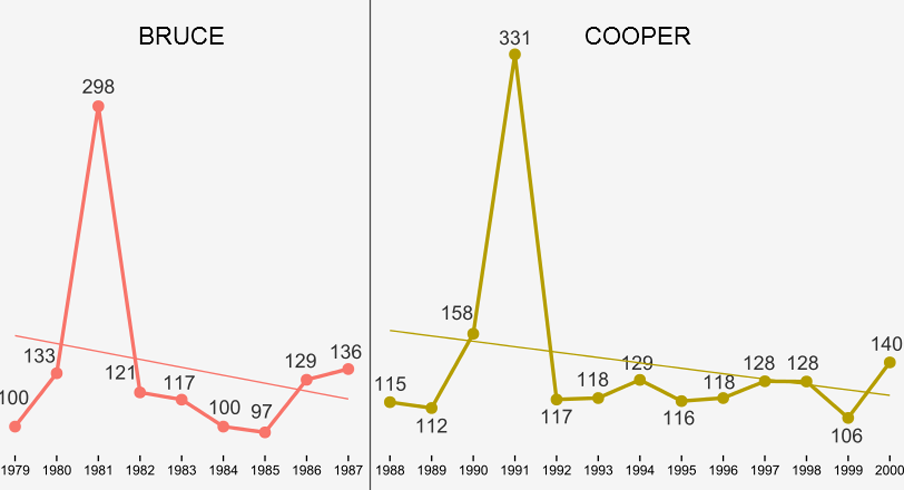
We next looked at the median distance in a basic line plot separated by coach. While Woody Hayes, Earle Bruce and John Cooper remain relatively flat – excluding what seems to be abnormal spikes – we see definite upward trends for both Jim Tressel and Urban Meyer (sorry for not including your name on the graph, Luke Fickell, but you did get your own dot):

Those spikes got us curious about what was happening in 1981, 1991 and 2013 that would cause such huge distance increases. 2013 was Urban Meyer’s first official recruiting class and of course we saw a spike due to the new coach and all of the hype he brought with him.
The years 1981 and 1991 didn’t have quite the same strong relationship to a specific incident as 2013, although Ohio Stadium did expand in 1990 from 86,071 seats to 91,470. So naturally we were curious to see which states were inflating the numbers for those particular years.
Using a heatmap plot, you can easily pick out which states were pushing those spikes upward – for example, four recruits from Virginia in 1981 and several recruits from Florida, California and Massachusetts in 1991:

Where the trend lines go from here we’ll have to wait and see, but hopefully it leads us to another National Championship.
614analytics, based in Columbus, provides analytic content for the everyday person, with unique perspectives and concrete analysis for Ohio-based sports along with takes on data visualization. You can follow them on Twitter, @614Analytics.
Submit your own data visualization ideas to 614Analytics and you may see it published (with a shout out).