This Week in Data, produced by Eleven Warriors and 614Analytics, explores the numbers behind Ohio State athletics through data visualization.
This week, we thought it would be interesting to take a look at a historical sample of offensive production for teams in the Big Ten. We collected the last 15 years of rushing and passing totals for the entire conference – including the new guys, Rutgers and Maryland.
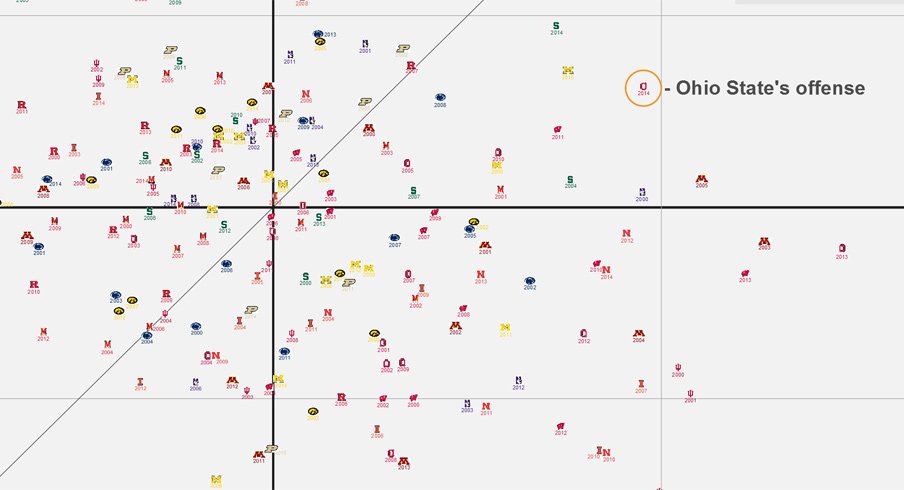
Looking at the entire set, the average game output per Big Ten team since 2000 is 162 yards on the ground and 214 yards through the air.
Each data point is how far above or below the 15 year average each team was for that year. For example, Purdue’s 2000 team was only a few yards below the average rushing and almost 100 yards over the average passing amount. Hello, Drew Brees! You’ll find Purdue 2000 at the top middle of the graph.

The two most timely data points for us are the 2014 Buckeyes and Wisconsin Badgers. Not that it needs to be said, but clearly Melvin Gordon is single-handedly pushing Wisconsin into the heavy rush skewed (lower right) quadrant. Ohio State's offense, as you can see, represents a well-balanced attack.
Other interesting notes are the 2005 Northwestern Wildcats (look at those stats and all of their ranked opponents that year), 2000 Illinois Fighting Illini (the mathematically “most average” team), and a decided lack of offensive production for early 2000s Rutgers.
Yes that’s a lot of data. Yes it’s fun to explore, but not so drill down into individual teams. Don’t worry, we got your back. Here’s each team broken out into its own mini-plot.

Each team has its own distinctive pattern: the rush heavy clusters of Wisconsin and Ohio State, the hypothetical centered cluster of Maryland and the well balanced grouping of Michigan State.
This graph may not tell you who will win the game but it does give us a good look into the offensive strengths and weaknesses of each Big Ten team since the turn of the century.
614analytics, based in Columbus, provides analytic content for the everyday person, with unique perspectives and concrete analysis for Ohio-based sports along with takes on data visualization. You can follow them on Twitter, @614Analytics.