 The defense will be back on track in no time
Following last week's look at the Big Ten using Mr. SEC's novel "Quick Strike" metric, this week's skull session will jump to the defense and the "Slow Grind" measure.
Mr. SEC describes his Quick Strike measure:
Slow Grind is our means of measuring a team’s defensive efficiency... In our Slow Grind analysis, we compare the number of touchdowns allowed by each team to the total number of offensive plays run against that team.
The resulting "Slow Grind" Score is effectively the average number of plays opponents take to score a touchdown.
It’s important to remember that this metric is not simply a measure of defensive success - it is at least partially dependent upon how well the offense and special teams win the field position battle.
All of you wondering why Urban’s looking to take a punter before another offensive guard, here’s your answer: field position matters.
Obviously, this also measure’s a team’s overall strength. A good offense limits an opponent’s time of possession. A good special teams unit hurts an opponent’s field position. Those teams that force their opponents to run the most amount of plays in order to score — causing a “slow grind” for their opponents — are ranked at the top of our standings.
I should note that I only included opponents’ offensive touchdowns - kick and punt returns, interceptions, and fumble returns weren’t the defenses’ faults. I again collected my data from cfbstats.com and as always, my dataset is available for download for anyone who wants to play with the data.
Predicting wins
A new metric is only really useful if it is actually correlated with winning, which the Slow Grind thankfully is:
| Wins | Coefficient | T score | p value |
|---|---|---|---|
| Slow Grind | .206 | 6.07 | 0.000 |
What does this mean? With 95% confidence we can say that the SG metric is an effective predictor of total wins. On average, a five unit unit increase in SG (that is, an additional five plays run per opponent TD) is correlated with an additional win.
To illustrate this finding, let's take a look at how Michigan's (11-2) defense was statistically better than Nebraska's (9-4). Nebraska averaged 22 plays per opponent touchdown in 2011 while Michigan surprisingly hit almost 31 - an average of 9 additional snaps per touchdown. Michigan had two more wins than the Huskers - exactly what we would expect with a 9 point higher Slow Grind.
the Buckeyes and hawkeyes grind
Two teams in the Big Ten regularly own this statistic - your Ohio State Buckeyes (obviously) and... the Iowa Hawkeyes. In fact, Iowa led the Big Ten in 2008 and 2009, with Ohio State taking second both year. 2008 and 2009 were so good for the "_eyes" teams that their SG scores were 2.2 standard deviations better than the mean for all teams across the four years. Not too shabby.
Things declined a bit for the Hawkeyes in 2010 and 2011, but that shouldn’t stop Kirk Ferentz for picking up yet another B1G coach of the year award next year.
Heacock was always known for his “bend but don’t break” defenses that was fine with letting opponents drive the field, but stiffening when needed to hold opponents to field goals at most. The numbers reinforce this trend - the Ohio State defense’s worst season was in 2008 when they gave up 19 touchdowns. The 2011 defense gave up 31 - about an additional touchdown per game.
the b1g in 2011
We’ve talked a lot about how poor the 2011 Buckeye offense was - it’s hard to be high flying when you’re confined to the running game - but the 2011 defense wasn’t much better compared to previous Buckeye defenses. The Buckeyes averaged just under 27 plays per opponent touchdown.
This is the beauty of the Slow Grind metric: while “total defense” puts the Buckeyes at 19th in the country, the Slow Grind puts Ohio State at just fifth in the B1G. That’s behind (in order) Penn State, Michigan, Michigan State, and Illinois, surprisingly. While 19th is certainly lower than Ohio State is used to, it's a respectable number. 5th in the Big Ten is not really.
After Ohio State and Wisconsin at 6th in the B1G, there’s a fairly steep drop-off in Slow Grind scores for 2011 - the bottom half of the B1G are clustered around a mean of 20.8 average plays per opponent touchdown.
Also, I’d like to give a shoutout to the 2011 Iowa defense, which was the only B1G defense in the last four years to have a whole number Slow Grind score. Congrats on a statistically improbable result!
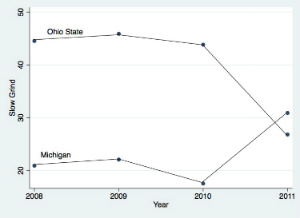
michigan rising
 ...Let's hope this trend doesn't continue.
 Michigan’s defense over the past four years has been just about Indiana-level bad (though not quite as bad as Minnesota’s terrible 2010 14.32 Slow Grind score), but it unfortunately looks like Greg Mattison is actually paying some crazy dividends.
Though we only have a single datapoint to go on, Michigan went from 9th to 2nd in the B1G in one year. It’s true that they couldn’t have gotten much worse (literally - only Indiana had a worse mean Slow Grind from 2008-2010), but their defensive improvement has been remarkable.
the future
I’m expecting a big time improvement in the SG metric for the 2012 Buckeyes. Several certifiably elite freshmen pass rushers have just moved in, which will surely aid a secondary that certainly failed to live up to expectations last year. The secondary itself can at least expect a better performance due to more game experience and all starters returning.
Also, I wouldn’t be surprised if Coach Coombs strapped on some shoulder pads and took the field at some point, so that’s got to leave you feeling optimistic.