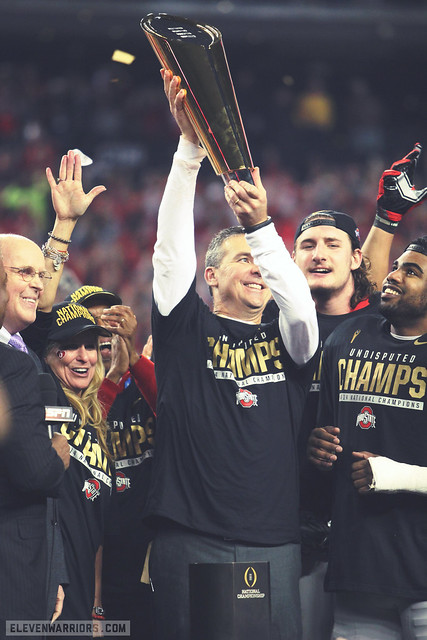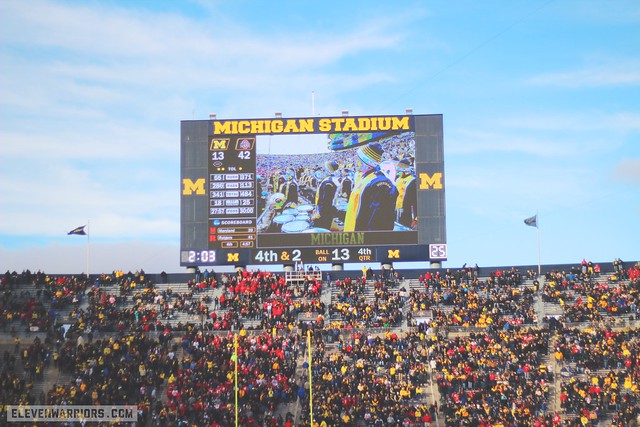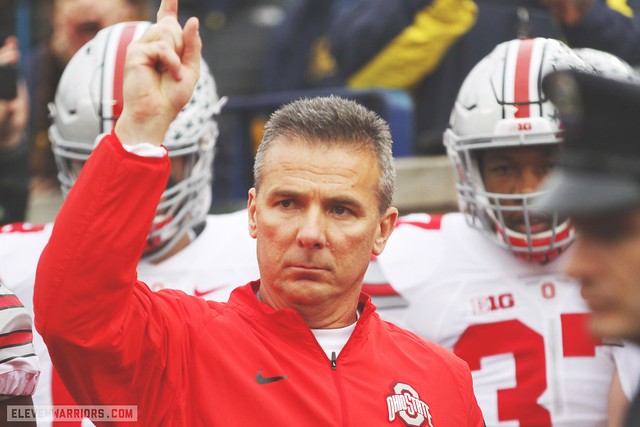
After four seasons as Ohio State's head coach, Urban Meyer is making his mark on the record books. He has Ohio State's highest winning percentage (.925) and he is the first coach to go 4-0 against That Team since Francis Schmidt (1934-36).
We know what Meyer has done with the wins and losses, but how has he done in the stat book. Below you will find two tables breaking down Ohio State's stats with Urban Meyer as head coach.
Table 1
Compares Meyer's first four seasons at Ohio State.
Table 2
Compares Meyer's first three season's stats through 12 games to the 2015 season.
The table below shows Ohio State's stats for the four seasons Urban Meyer has been head coach. All seasons show Ohio State's average stats through 12 games.
| CATEGORY | 2012 | 2013 | 2014 | 2015 | 4-YEAR AVG | ||
|---|---|---|---|---|---|---|---|
| Points For | 37.0 | 48.2 | 44.1 | 35.0 | 41.1 | ||
| Points Against | 23.0 | 20.3 | 22.9 | 14.0 | 20.1 | ||
| OFFENSE | |||||||
| Rushing Offense | 242.0 | 321.3 | 257.4 | 241.9 | 265.7 | ||
| Passing Offense | 182.0 | 209.3 | 246.0 | 187.0 | 206.1 | ||
| Total Offense | 424.0 | 530.6 | 503.4 | 428.9 | 471.7 | ||
| DEFENSE | |||||||
| Rushing Defense | 116.0 | 100.0 | 145.6 | 127.3 | 122.2 | ||
| Passing Defense | 244.0 | 255.8 | 188.3 | 176.2 | 216.1 | ||
| Total Defense | 360.0 | 355.8 | 333.8 | 303.5 | 338.3 | ||
| OFF. MISC. | |||||||
| 3rd Down Conv. | NA | .521 | .529 | .390 | .480 | ||
| Red Zone | NA | .946 | .833 | .800 | .860 | ||
| Punt Return | 10.4 | 8.7 | 12.4 | 12.3 | 11.0 | ||
| Kickoff Return | 19.9 | 22.9 | 23.3 | 23.0 | 22.3 | ||
| DEF. MISC. | |||||||
| 3rd Down Conv. | NA | .345 | .379 | .347 | .357 | ||
| Red Zone | NA | .789 | .838 | .786 | .804 | ||
| Pass Eff. Def. | 116.8 | 128.4 | 108.4 | 101.9 | 113.9 | ||
| Net Punting | 36.3 | 39.8 | 40.0 | 40.2 | 39.1 | ||
| The Edge | 0 | 6 | 4 | 6 |
Three Things 2014 To 2015
- The Buckeyes improved in 8 categories from 2014 to 2015.
- Ohio State declined in all of the offensive categories from 2014 to 2015.
- The Silver Bullets are better in every defensive category when comparing 2014 to 2015.
 We don't give a damn for that whole state.
| '12-'14 AVG | CATEGORY | 2015 | DIFFERENCE |
|---|---|---|---|
| 43.1 | Points For | 35.0 | - 8.1 |
| 22.1 | Points Against | 14.0 | + 8.1 |
| OFFENSE | |||
| 271.7 | Rushing Offense | 241.9 | - 29.8 |
| 210.8 | Passing Offense | 187.0 | - 23.8 |
| 486.0 | Total Offense | 428.9 | - 57.1 |
| DEFENSE | |||
| 120.5 | Rushing Defense | 127.3 | - 6.8 |
| 229.4 | Passing Defense | 176.2 | + 53.2 |
| 349.9 | Total Defense | 303.5 | + 46.4 |
| OFF. MISC. | |||
| .525 | 3rd Down Conv. | .390 | - .135 |
| .890 | Red Zone | .800 | - .090 |
| 10.5 | Punt Return | 12.3 | + 1.8 |
| 22.0 | Kickoff Return | 23.0 | + 1.0 |
| DEF. MISC. | |||
| .362 | 3rd Down Conv. | .347 | + .015 |
| .814 | Red Zone | .786 | + .028 |
| 117.9 | Pass Eff. Def. | 101.9 | + 16.0 |
| 38.7 | Net Punting | 40.2 | + 1.5 |
| 7 | THE EDGE | 9 |
3 Things Comparing Ohio State 2015 To the 2012-2015 Average
- The offensive numbers confirm what many Ohio State fans have believed. The Buckeyes' offensive numbers are not as good as the 2012-2014 average.
- It is interesting that the Buckeyes are 8.1 points better in points allowed and 8.1 points worse in offensive scoring this year.
- The 2015 version of the Silver Bullets is by far Urban Meyer's best defense at Ohio State since his arrival.
 Going forward Ohio State is in good hands.
