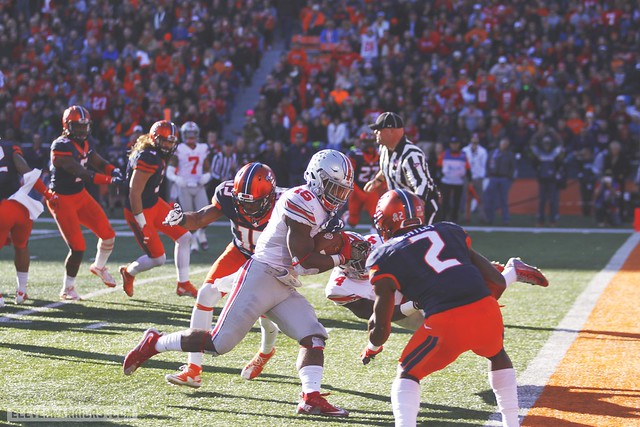
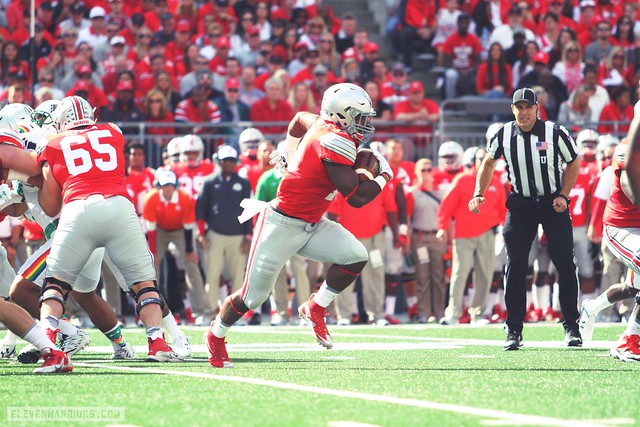
This miniseries will look at Ohio State's effect on its opponents through the first 10 weeks of the season. It's always interesting to see if there are any trends in Ohio State's play. Tonight we will look at the effect the Silver Bullets had on their opponent's total rushing yards and total passing yards gained.
Below you will see what Ohio State's offense has done to opponents and their Points Allowed stats in 2015. The teams are listed in the order the Buckeyes played them.
Note:
Negative (-) numbers are good for Ohio State.
Positive (+) numbers are bad for Ohio State.
3 Things Opponent's Points Allowed Stats
- Ohio State had the largest scoring differences against Penn State (- 23.7) and Rutgers (- 19.8).
- The Buckeyes have put a hurting on their opponent's points allowed stats. Ohio State has scored more than the season average against 9 out of 10 teams.
-
If the average holds true you can expect Ohio State to score 11 more points than what an opponent typically allows.
| TEAM | AVG. BEFORE OHIO STATE | POINTS OHIO STATE SCORED | DIFFERENCE | RANK BEFORE | RANK AFTER |
|---|---|---|---|---|---|
| VIRGINIA TECH | 20.2* | 42 | - 21.8 | ||
| HAWAI'I | 20.0 | 38 | - 18.0 | 62nd | 88th |
| NORTHERN ILLINOIS | 28.0 | 20 | + 8.0 | 85th | 75th |
| WESTERN MICHIGAN | 33.3 | 38 | - 4.7 | 108th | 110th |
| INDIANA | 32.0 | 34 | - 2.0 | 97th | 97th |
| MARYLAND | 31.8 | 49 | - 7.2 | 95th | 103rd |
| PENN STATE | 14.3 | 38 | - 23.7 | 11th | 20th |
| RUTGERS | 29.2 | 49 | - 19.8 | 84th | 96th |
| MINNESOTA | 23.9 | 28 | - 4.1 | 49th | 50th |
| ILLINOIS | 21.7 | 28 | - 6.3 | 33rd | 34th |
| AVERAGE | 25.4 | 36.4 | - 11.0 | 69th | 75th |
*2014 Average

| TEAM | SEASON AVG. WITHOUT OHIO STATE | POINTS OHIO STATE SCORED | DIFFERENCE |
|---|---|---|---|
| VIRGINIA TECH | 22.0 | 42 | - 20.0 |
| HAWAI'I | 35.7 | 38 | - 2.3 |
| NORTHERN ILLINOIS | 25.9 | 20 | - 5.9 |
| WESTERN MICHIGAN | 26.9 | 38 | - 11.1 |
| INDIANA | 38.6 | 34 | + 4.6 |
| MARYLAND | 30.7 | 49 | - 18.3 |
| PENN STATE | 15.4 | 38 | - 22.6 |
| RUTGERS | 33.7 | 49 | - 15.3 |
| MINNESOTA | 25.7 | 28 | - 2.3 |
| ILLINOIS | 21.7 | 28 | - 6.3 |
| AVERAGE | 27.6 | 36.4 | - 8.8 |
Although Ohio State's offense is not scoring 44.8 points like it did last season the Buckeyes are still putting up a healthy 36.4 points per game. When you look at the point differential between points scored and points allowed the Buckeyes are right on track with last season.
| YEAR | POINTS SCORED | PTS ALLOWED | DIFFERENCE |
|---|---|---|---|
| 2014 | 44.8 (5th) | 22.0 (26th) | + 22.8 |
| 2015 | 36.4 (28th) | 13.8 (2nd) | + 22.6 |
It is true that defense wins championships. However, you still need to score more points than the opposing team.
Below you will see what Ohio State's offense has done to opponents and their Total Yards Allowed stats in 2015. The teams are listed in the order the Buckeyes played them.
Note:
Negative (-) numbers are good for Ohio State.
Positive (+) numbers are bad for Ohio State.
3 Things Opponent's Total Yards Allowed Stats
- Ohio State had the largest difference against Penn State (- 153.3) and Illinois (- 98.1).
- The Buckeyes were on the positive side of total yards in 8 out of 10 games.
- If the average holds true you can expect Ohio State to gain for 63.4 more total yards than their opponents usually allow.
| TEAM | AVG. BEFORE OHIO STATE | TOTAL YARDS OHIO STATE GAINED | DIFFERENCE | RANK BEFORE | RANK AFTER |
|---|---|---|---|---|---|
| VIRGINIA TECH | 343.8* | 572 | - 228.2 | ||
| HAWAI'I | 371.0 | 363 | + 8.0 | 68th | 64th |
| NORTHERN ILLINOIS | 433.0 | 298 | + 135.0 | 96th | 75th |
| WESTERN MICHIGAN | 413.0 | 511 | - 98.0 | 93rd | 96th |
| INDIANA | 499.0 | 517 | - 18.0 | 117th | 118th |
| MARYLAND | 449.4 | 499 | - 49.6 | 109th | 110th |
| PENN STATE | 275.7 | 429 | - 153.3 | 10th | 16th |
| RUTGERS | 447.3 | 528 | - 80.7 | 105th | 111th |
| MINNESOTA | 324.6 | 376 | - 51.4 | 25th | 24th |
| ILLINOIS | 341.9 | 440 | - 98.1 | 31st | 36th |
| AVERAGE | 389.9 | 453.3 | - 63.4 | 65th | 65th |
*2014 Average
Ohio State has gained over 500 yards of total offense in 4 games in 2015. For the season the Buckeyes are averaging 453.3 yards of total offense. In 2014 Ohio State averaged 511.6 yards per game. That is a difference of 58.3 yards. Both the rushing and passing yards have gone done in 2015, but the biggest drop has been in the passing game.
Will this drop in offensive productivity cost Ohio State a national title? Not if the defense continues to stifle opposing offenses.

| TEAM | SEASON AVG. WITHOUT OHIO STATE | TOTAL YARDS OHIO STATE GAINED | DIFFERENCE |
|---|---|---|---|
| VIRGINIA TECH | 310.6 | 572 | - 261.4 |
| HAWAI'I | 458.6 | 363 | + 95.6 |
| NORTHERN ILLINOIS | 390.4 | 298 | + 92.4 |
| WESTERN MICHIGAN | 388.6 | 511 | - 122.4 |
| INDIANA | 562.2 | 517 | + 45.2 |
| MARYLAND | 385.6 | 499 | - 113.4 |
| PENN STATE | 298.1 | 429 | - 130.9 |
| RUTGERS | 439.9 | 528 | - 88.1 |
| MINNESOTA | 344.8 | 376 | - 31.2 |
| ILLINOIS | 341.9 | 440 | - 98.1 |
| AVERAGE | 392.1 | 453.3 | - 61.2 |
To this point, Ohio State's defense has held opposing offenses to 13.8 points per game. Six times this season the Silver Bullets have held opponents to double digits below their season points scored average.
Defense wins championships. If the Buckeyes' continue to limit opponents to under 14 points per game a second title should belong to Ohio State.
This Week's Articles
Ten Weeks Of The Ohio State Effect: Defensive Rushing Yards and Defensive Passing Yards
Ten Weeks Of The Ohio State Effect: Defensive Total Points and Defensive Yards Allowed
The Rundown: No. 9 Michigan State at No. 3 Ohio State
The Series History: Michigan State
